Observability

See Everything. Govern Everything.

Fleet-scale observability for autonomous AI agents. Real-time dashboards, anomaly detection, drift monitoring, and auto-remediation. OpenTelemetry-native.

The Visibility Gap

You can't govern what you can't see.

Blind Spots

Most AI deployments have no fleet-wide visibility. Individual agent logs exist, but no unified operational picture.

No Fleet View

How many agents are running? What are they doing? Which ones are healthy? Most teams can't answer these questions.

Manual Incident Response

When an agent misbehaves, teams scramble to find logs, identify the root cause, and manually intervene.

Scattered Telemetry

Agent metrics spread across different clouds, different tools, different formats. No single source of truth.

Dashboards

Real-Time Governance Dashboard

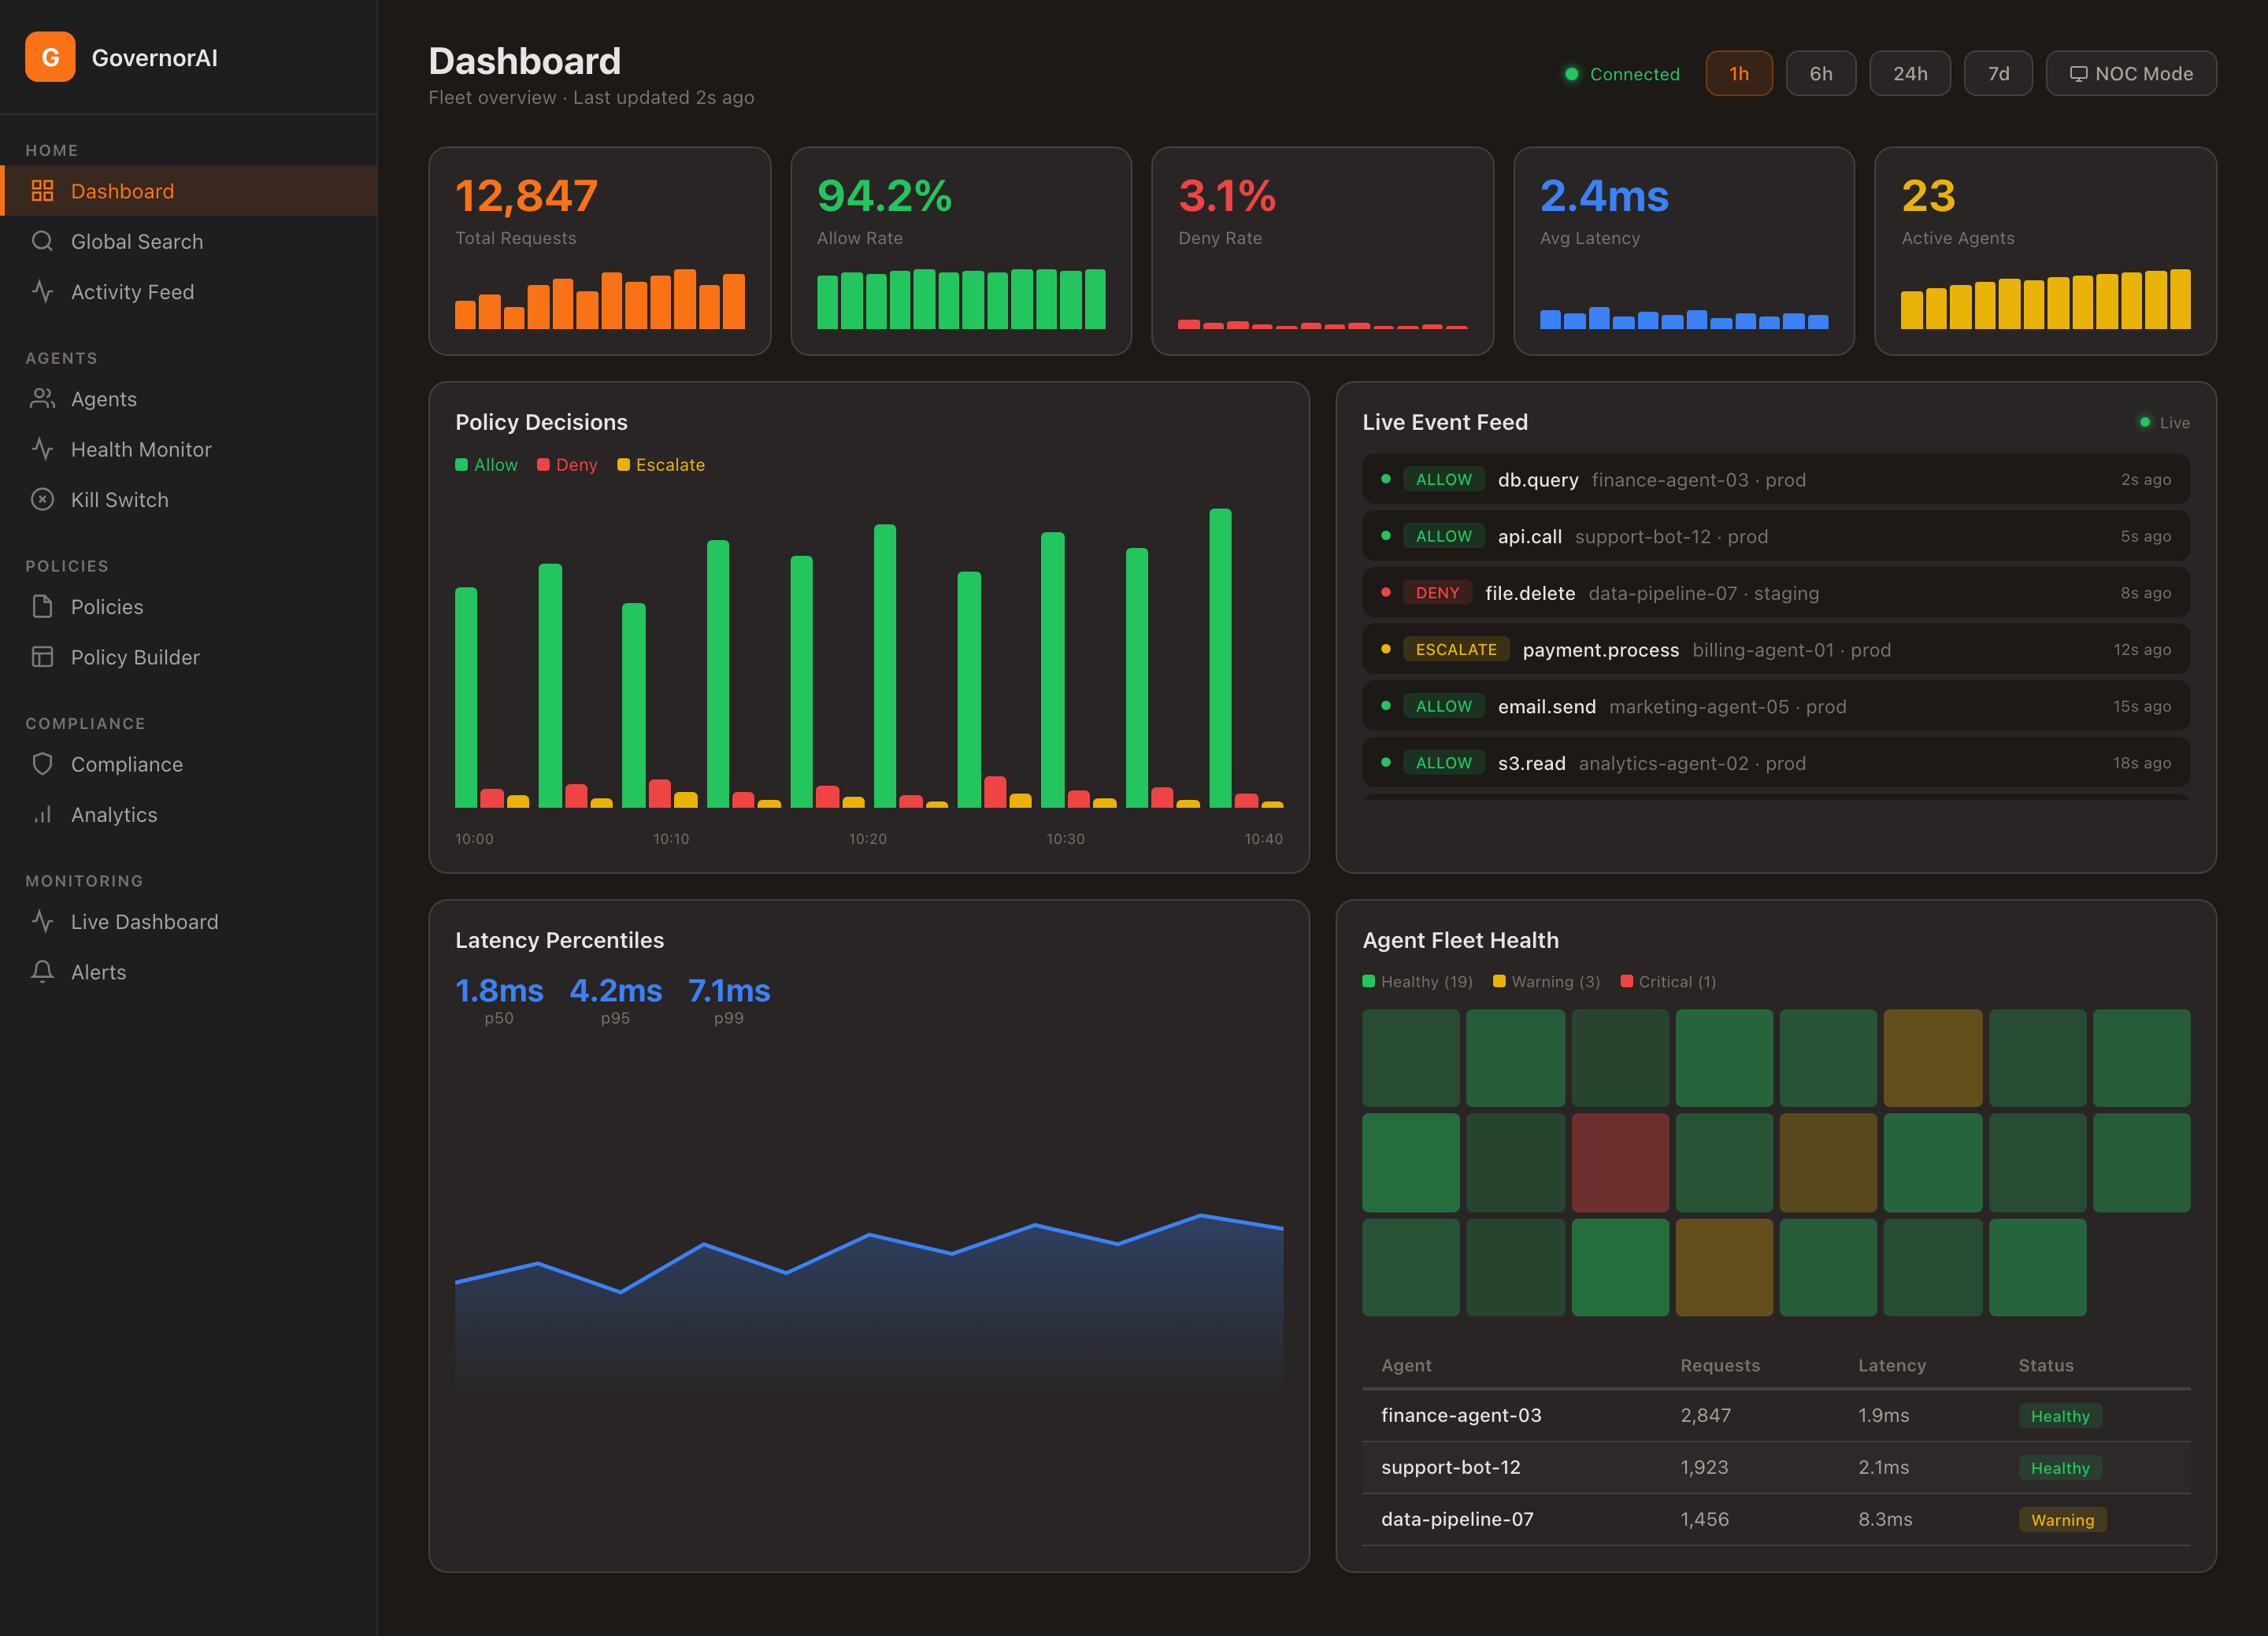
A single pane of glass for your entire AI fleet. Agent inventory, session tracking, policy hit rates, anomaly scores, and operational health—all in real time.

  • Agent inventory and health status
  • Live session tracking
  • Policy evaluation heat maps
  • Anomaly score trending
GovernorAI Fleet Dashboard — Real-time KPI metrics, policy decisions, live event feed, latency percentiles, and agent health grid

Fleet Metrics

Every metric you need to operate AI at scale.

Active Agents

Real-time count of registered agents, their health status, and last heartbeat timestamp.

Session Volume

Active sessions, session duration distribution, and step counts per session.

Policy Evaluation Rate

Evaluations per minute, allow/deny/approval ratios, and policy hit distribution.

Approval Queue

Pending approvals, average approval time, timeout rates, and approver response metrics.

Kill Switch Status

Active kill switches, scope, reason, TTL remaining, and propagation confirmation.

Drift Events

Policy drift detection across multi-cloud deployments. Semantic parity monitoring in real time.

Detection

Anomaly Detection

Automated detection of abnormal agent behavior. Configurable thresholds, severity escalation, and automatic containment when anomalies exceed tolerance.

  • Behavioral anomaly scoring
  • Configurable thresholds per agent
  • Severity escalation: INFO → CRITICAL
  • Auto kill switch on EMERGENCY
Rogue Detection →
YAML
anomaly_detection:
  enabled: true
  scoring:
    deny_rate_threshold: 0.15
    unusual_tool_weight: 2.0
    rate_spike_window: 5m

  escalation:
    warning:
      score_threshold: 50
      notify: ["ops-team"]
    critical:
      score_threshold: 80
      notify: ["security-team"]
    emergency:
      score_threshold: 95
      action: kill_switch

Observability Integrations

Export GovernorAI telemetry to your existing observability stack.

OpenTelemetry

Native OTLP export. Traces, metrics, and logs in standard format.

Datadog

Direct integration via OTLP or Datadog Agent.

Splunk

HEC export for structured governance events.

Elastic

Native Elasticsearch/Kibana integration.

PagerDuty

Alert routing for anomalies and kill switch events.

Grafana

Prometheus metrics + Grafana dashboards out of the box.

Circuit Breakers & Auto-Remediation

Automatic response when thresholds are exceeded.

Circuit Breakers

Configurable circuit breakers that trigger when error rates, deny rates, or latency exceed thresholds. Automatic backoff and recovery.

Auto-Remediation

Automated response playbooks for common anomaly patterns. Escalate to human operators only when automatic remediation fails.

Observe Your AI Fleet

See how GovernorAI provides fleet-scale observability for your AI agents.