PLATFORM / DECISION OBSERVABILITY

See the decision behind the action.

An investigation should not start with a log line. It should start with what the agent attempted, which policy version decided it, and why the control allowed, blocked, or escalated it — then follow that verdict forward into the incident, the evidence, and the policy change it caused.

Live decision feed Fleet health and drift Governance graph Incident to post-mortem
One verdict TYPED EVENT event action.evaluated agent billing-agent-v4 tool erp.process_payment args_hash sha256:7c31…a904 policy refund-approval-v4 · rev 12 risk 74 · high decision require_approval reason above tier threshold seam gateway_execute latency_ms 6 Not a log line. The record everything else hangs off.

The unit of observation is the verdict, not the response. Most tooling watches what an agent produced; this watches what it was permitted to do.

typed eventgovernance graphlive feeddecision, not conversation

THE UNIT OF OBSERVATION

The unit is the verdict, not the response.

Most tooling watches what an agent produced. GovernorAI watches what it was permitted to do. Every governed call resolves to a decision, and that decision is the record everything else hangs off — the alert, the incident, the evidence entry, and the next policy revision.

DECISIONS

Live decision feed

Verdicts broadcast over an authenticated, org-scoped WebSocket as the gateway resolves them — filterable by event type, namespace, agent and minimum severity, with the last hundred events replayed to a client that joins late.

Decision · alert · drift · policy change
RECORD

A typed event, not a log line

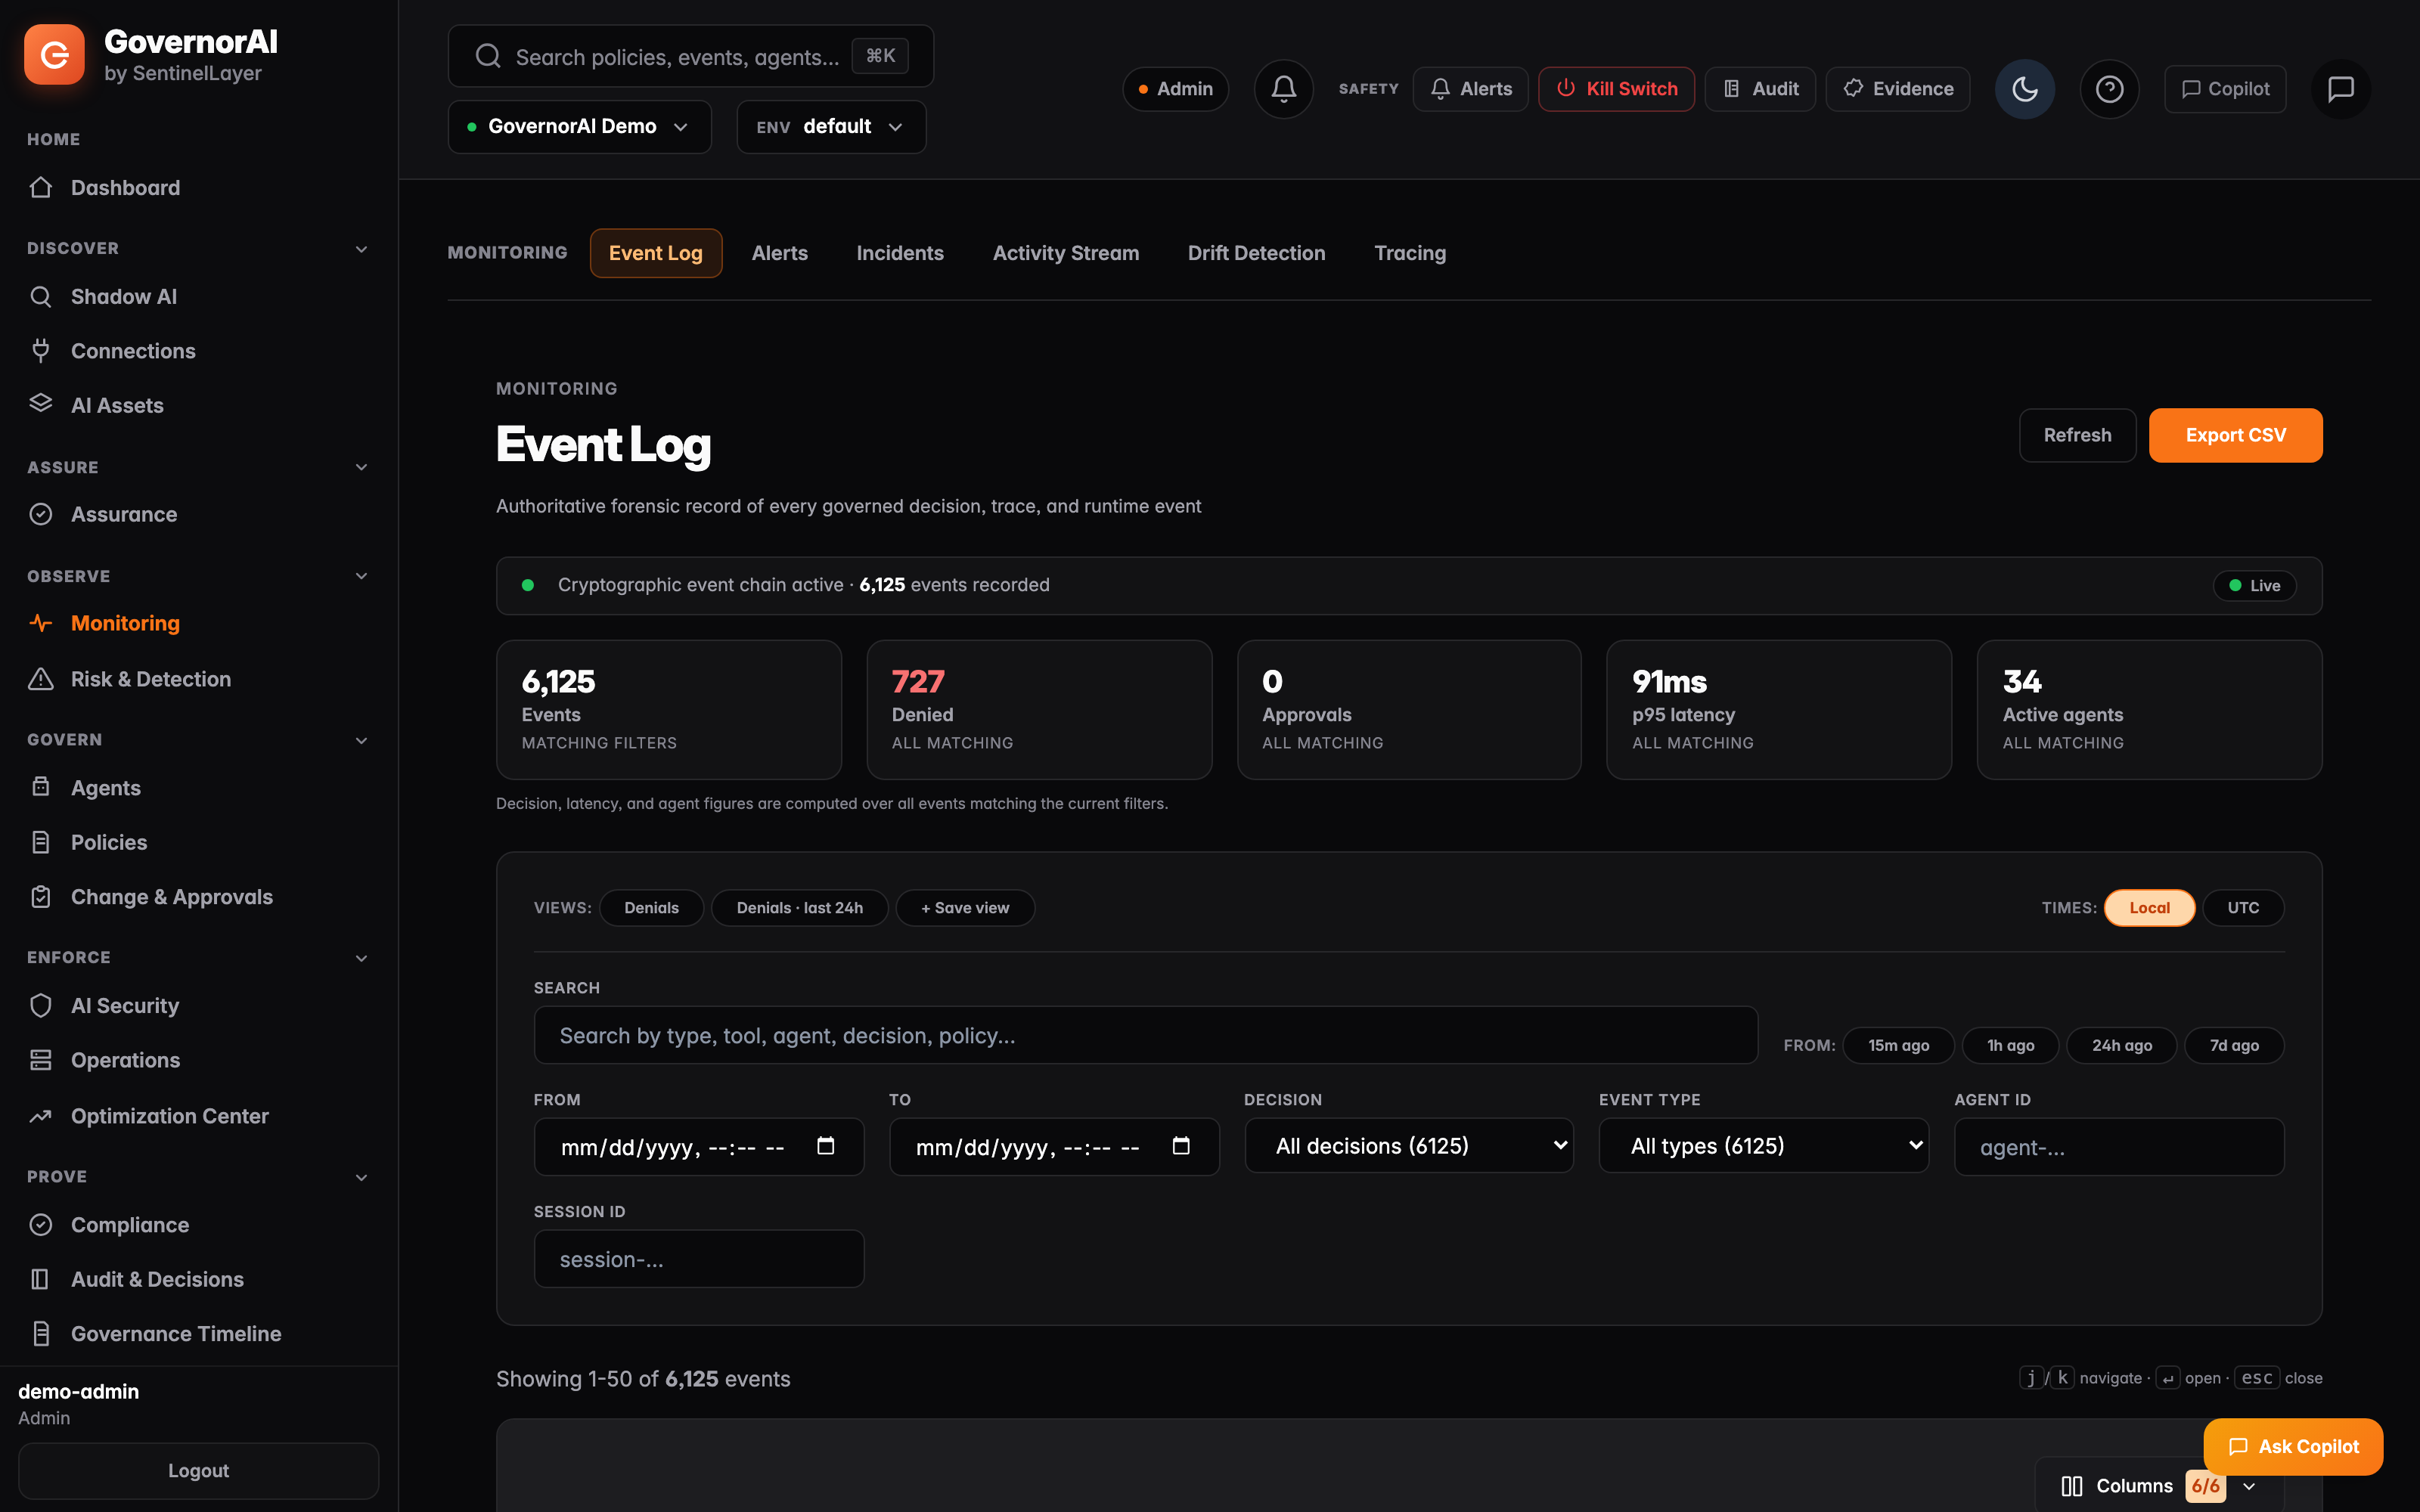
Every governed action writes a typed event — requested, evaluated, executed, denied, paused — alongside approvals, session lifecycle, kill-switch activations and policy changes. Call arguments are recorded as SHA-256 digests, never as raw values.

Arguments hashed, not stored
CONTEXT

Risk score on the action

A composite 0–100 score from eight weighted factors — action and data sensitivity, agent trust, temporal context, financial impact, compliance context, pattern deviation and MCP server risk — available to the policy engine as decision input, and mapped to NIST AI RMF functions.

Risk engine
FLEET

Agent fleet health

Decision latency at p50, p95 and p99 per governed agent, computed in the database over the last 24 hours of evaluated actions, and each agent placed against the fleet's own percentile distribution — good, warning or bad relative to the estate you actually run.

Ranked against your fleet
GRAPH

Governance graph

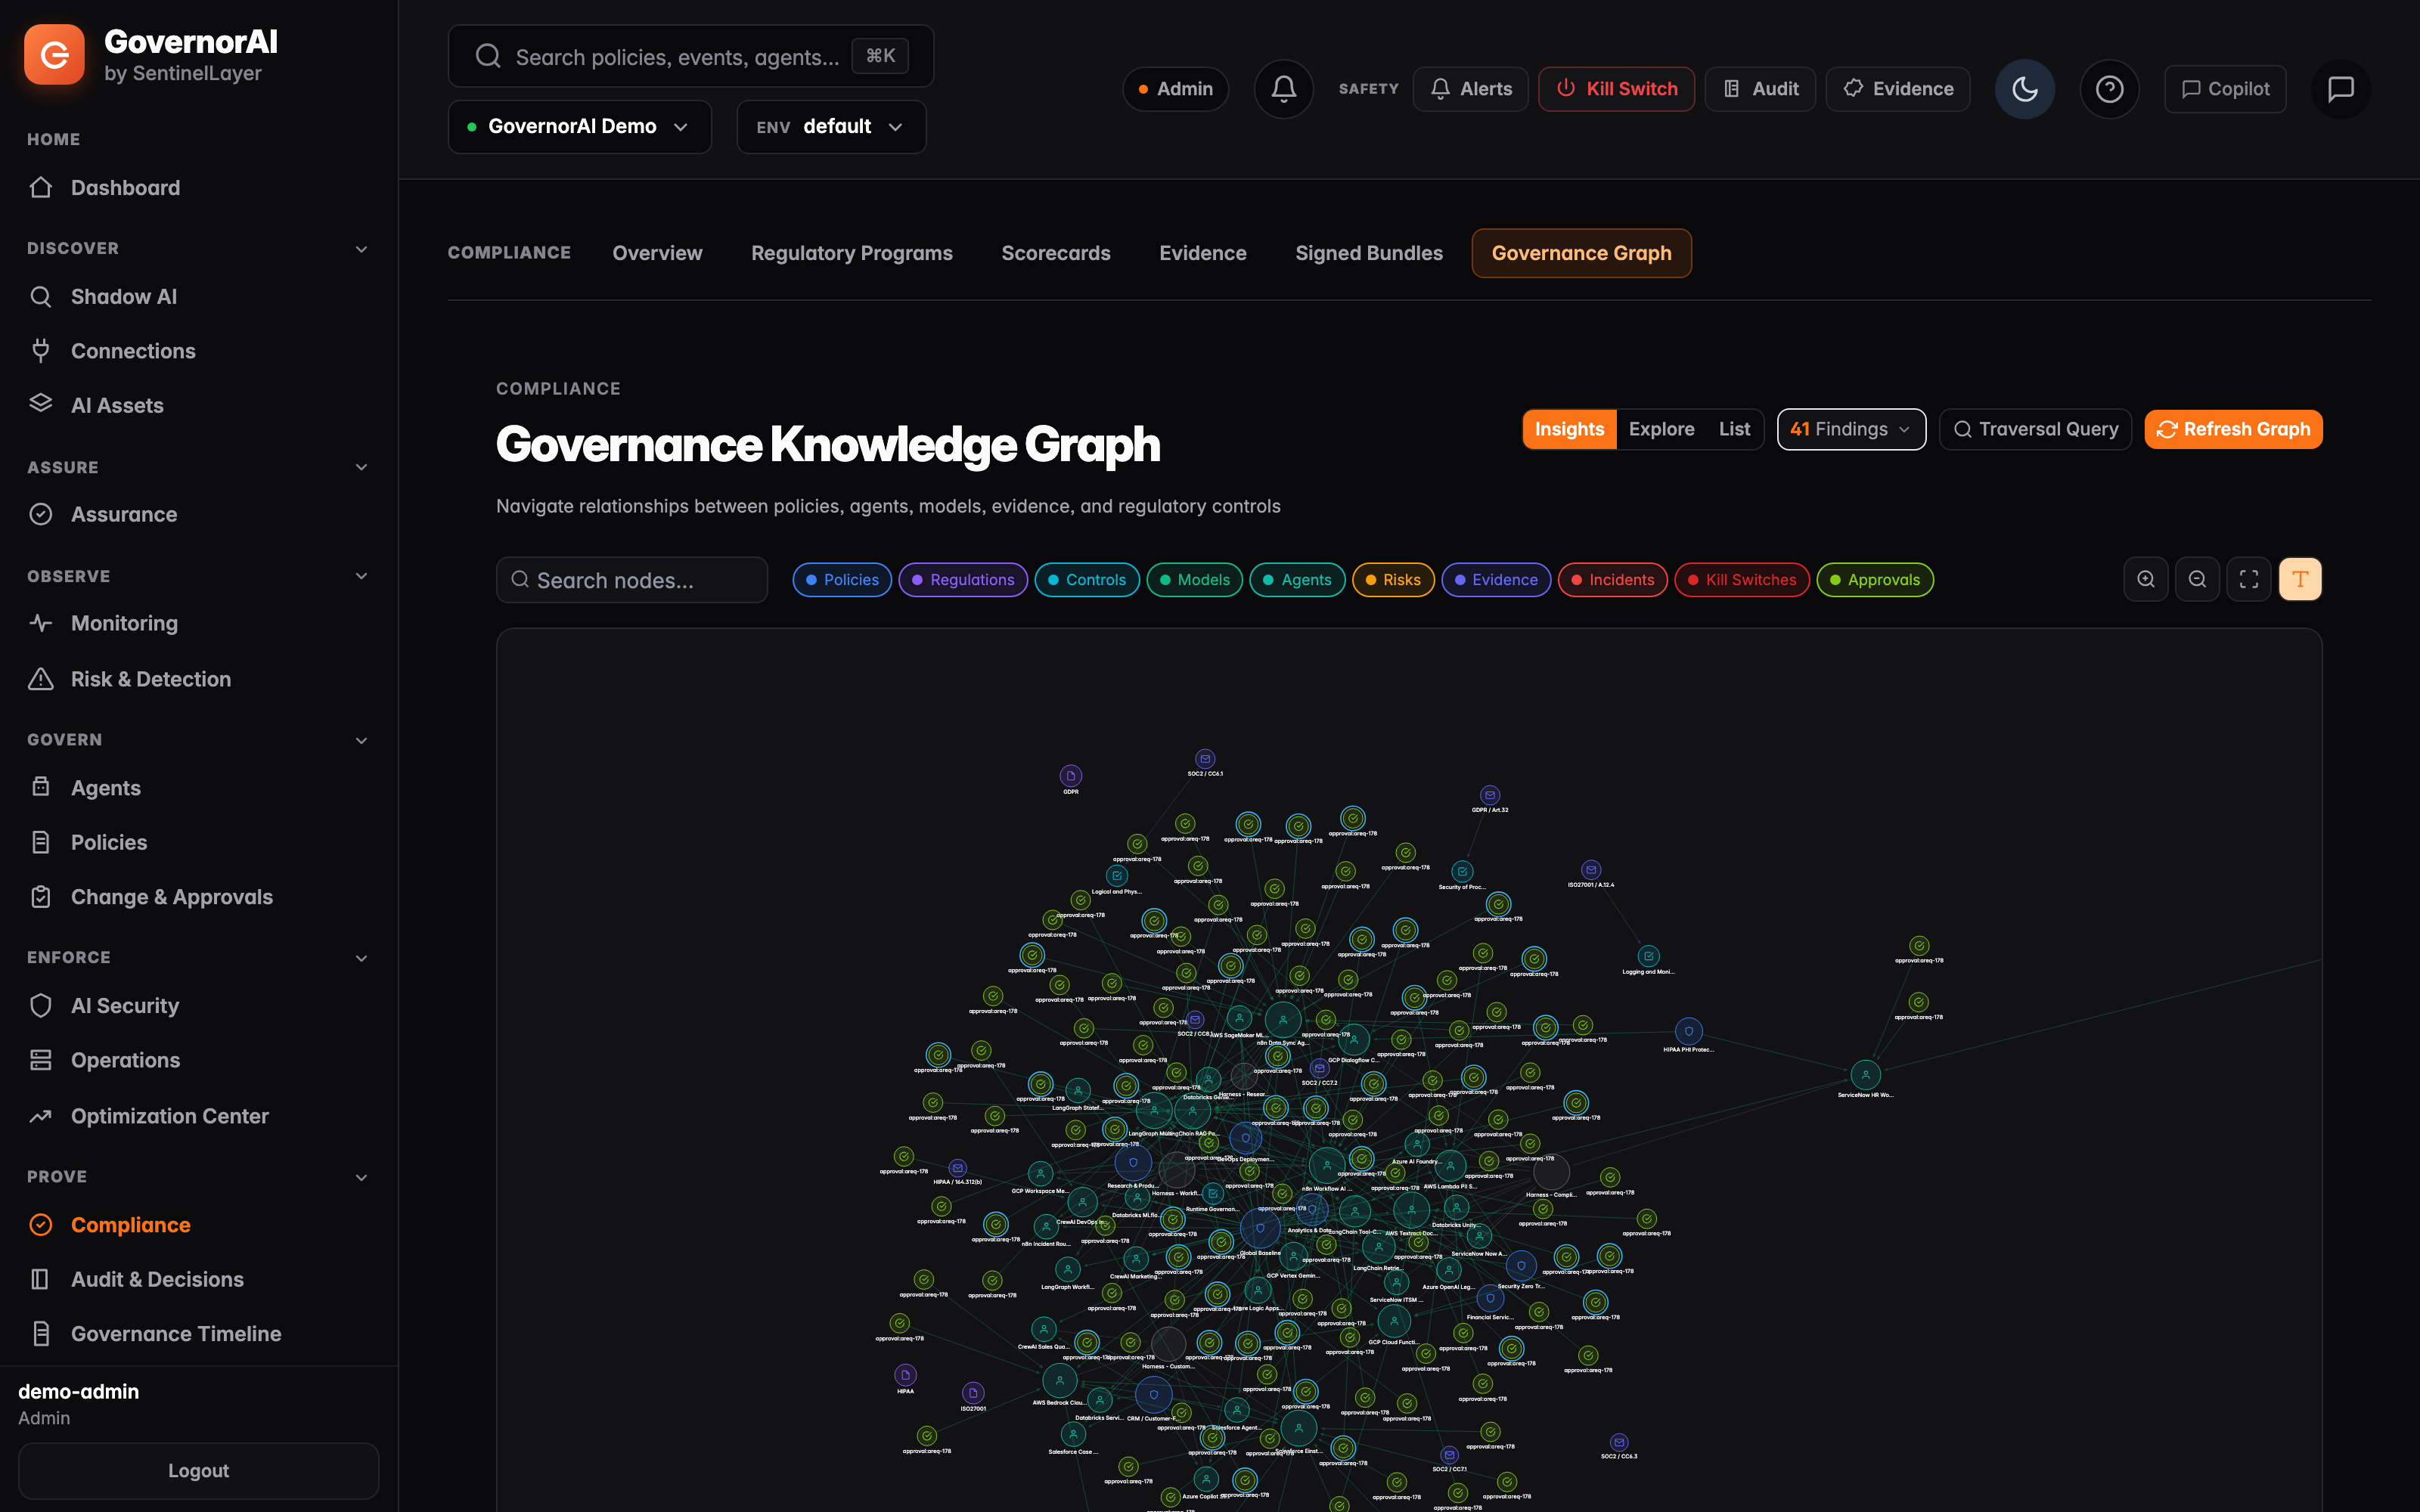
Typed nodes for policies, controls, regulations, models, agents, groups, evidence, incidents, approvals and kill switches, joined by typed edges — assigned_to, governs, member_of, supports, triggered_by, derived_from.

Derived, not hand-drawn
ALERTS

Rules that can act

Thresholds and spike conditions on deny rate, error rate, p95 and p99 latency, request count and queue depth — scoped globally or to a namespace, agent or policy — with actions that include opening an incident, pausing a policy, or engaging a kill switch.

Observation feeds enforcement
Stated precisely Decision observability records the governance decision and everything it caused, at the seams GovernorAI already governs.

Coverage follows enforcement coverage — it does not exceed it. Where there is no supported action seam, there is no decision to observe, and the console says so rather than filling the gap with an inferred value.

Honesty note — what this is, and what it is not

This is decision observability: policy verdicts, approvals, action context, drift in governance outcomes, fleet health, and the evidence trail — the record of what a control did and why. It is not a measure of your model's output. GovernorAI does not score, grade, or evaluate what an agent said or produced, and nothing on this page should be read as that claim. If you need output evaluation, that is a different category of tool and we do not pretend to be it. What we will tell you is whether the action that followed was permitted, by which policy, under whose approval, and what happened next.

THE CONSOLE

One surface where the verdict, the fleet and the feed sit together.

Decision volume and outcome mix, decision latency at the percentiles that matter, the live verdict stream, and per-agent health — read together, because an incident is rarely visible in only one of them.

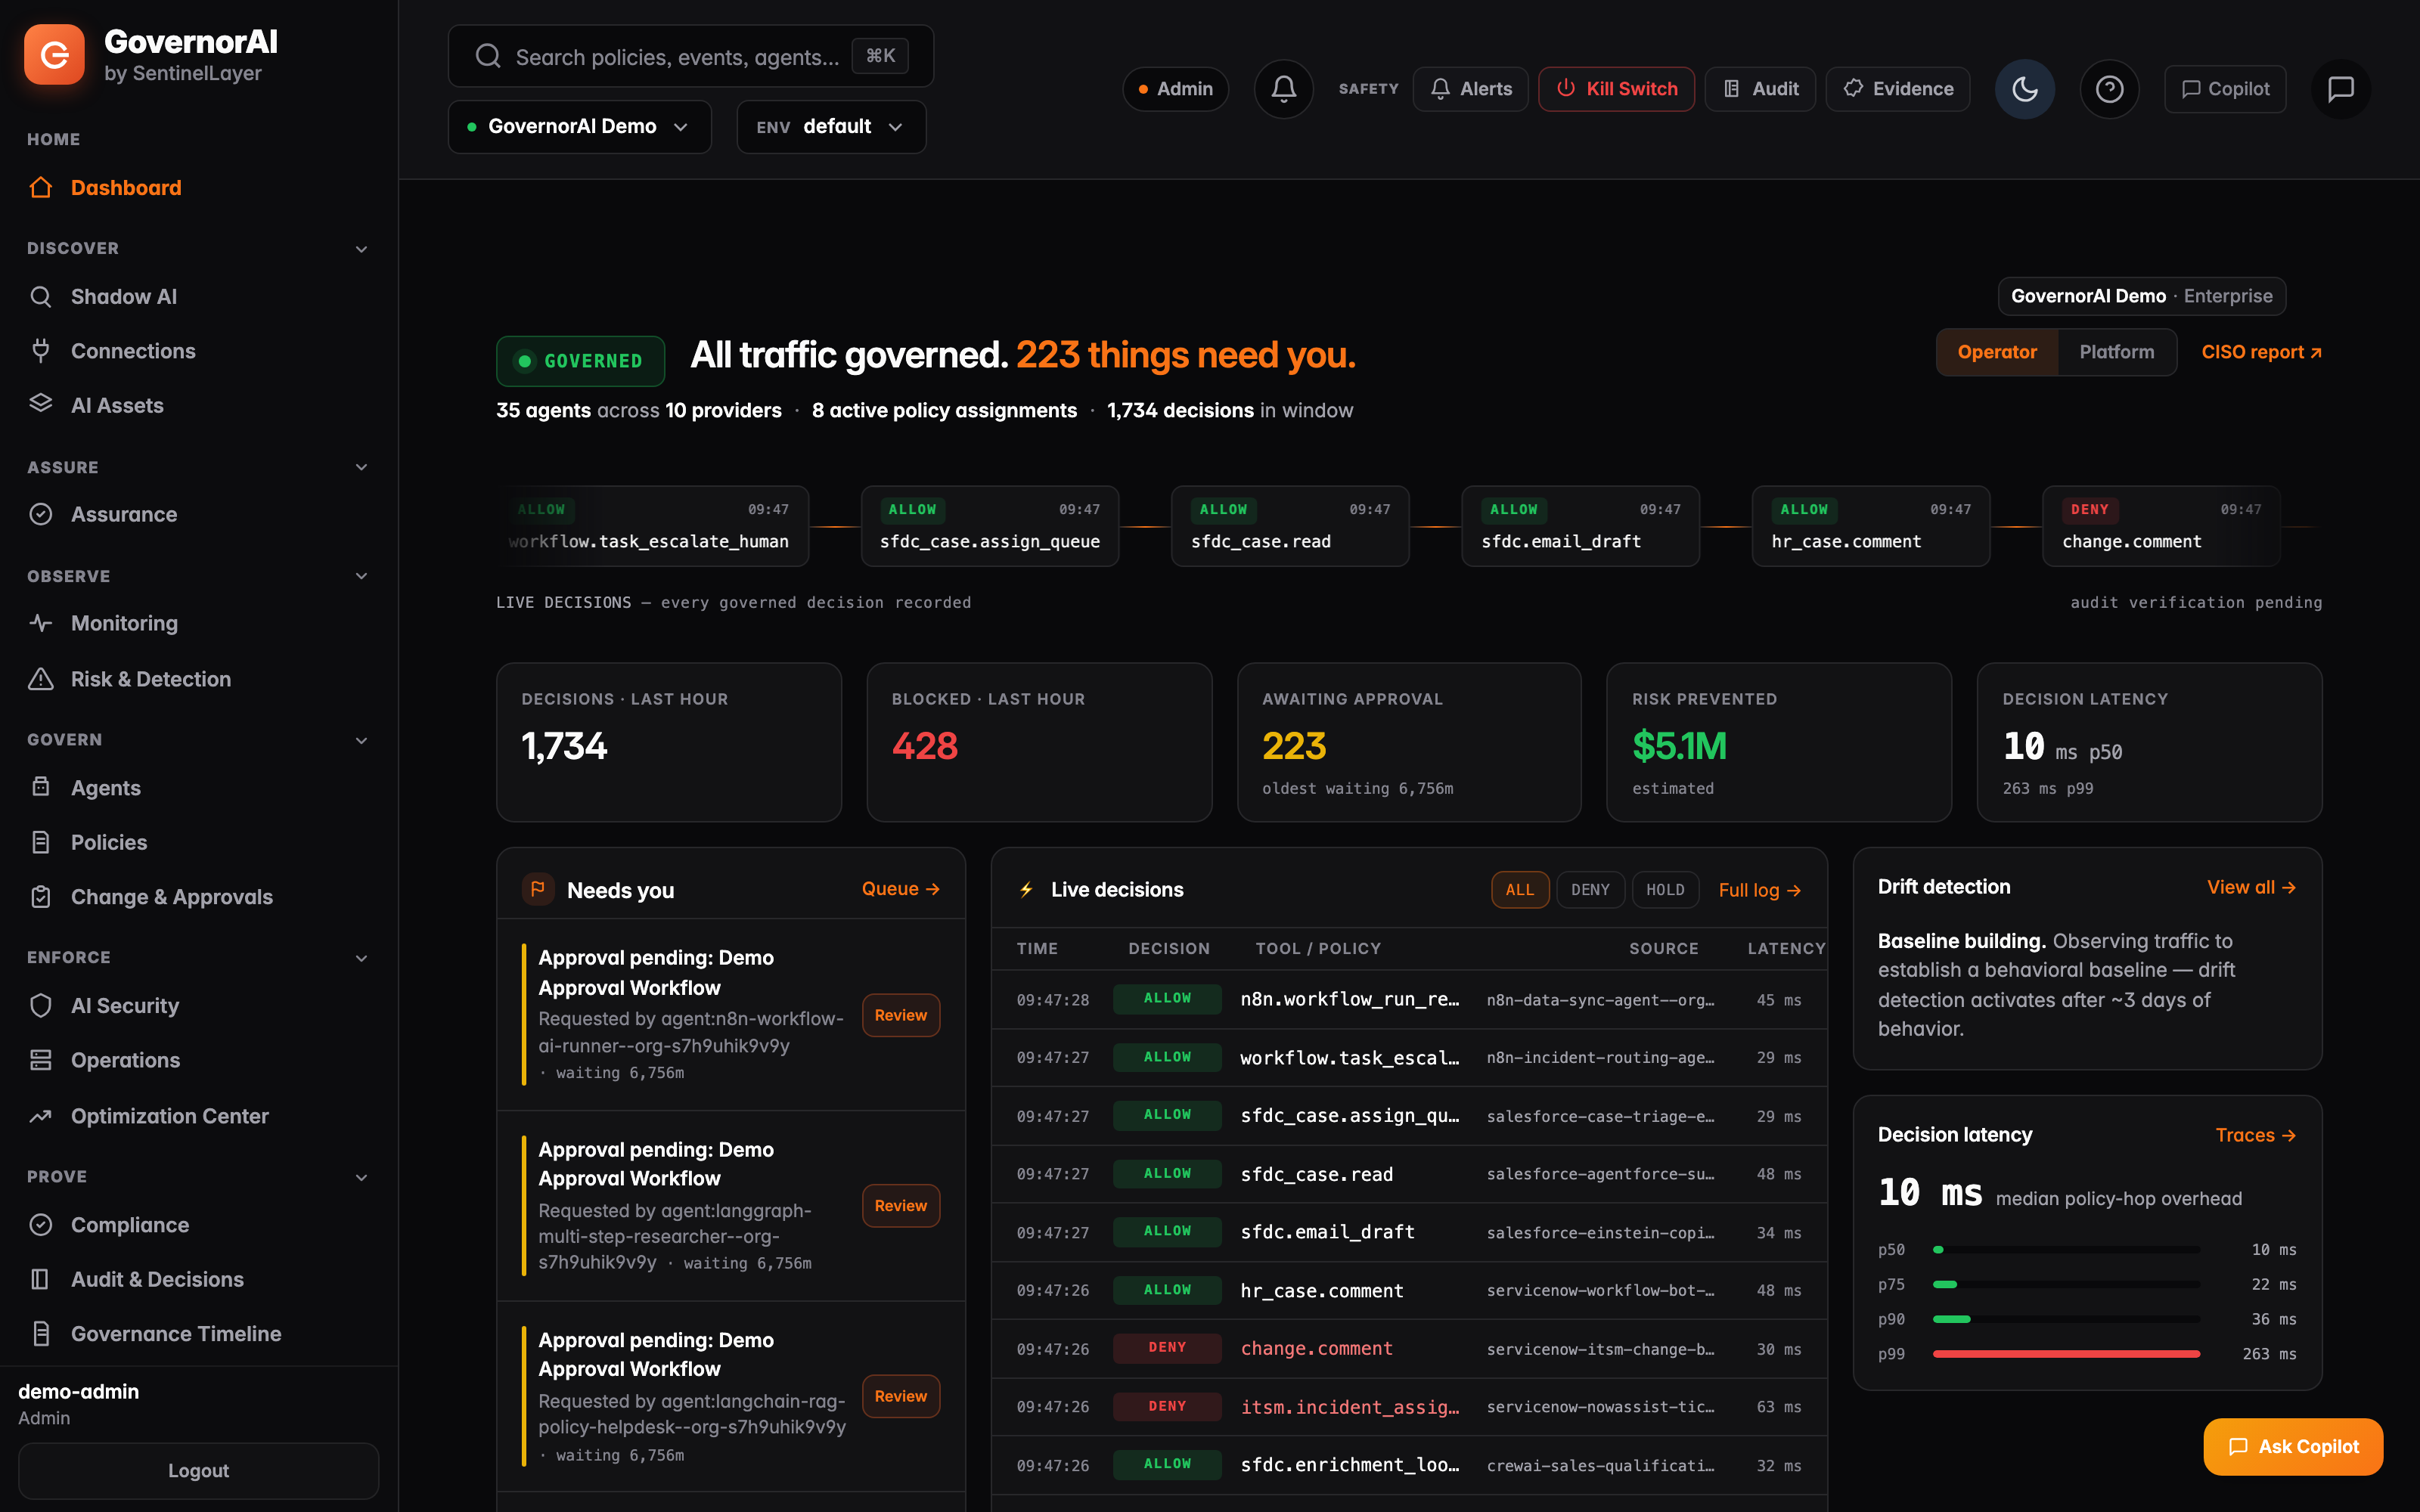
GovernorAI dashboard header reading 35 agents across 10 providers, 8 active policy assignments and 1,768 decisions in window, above tiles for decisions and blocked calls in the last hour, items awaiting approval and decision latency at the 50th percentile, with a live verdict feed naming each tool call, its policy source and its latency, an approval queue, and a latency breakdown at p50, p75, p90 and p99
Live capture from a demo tenant. Real product, simulated traffic.

This is the running console, not an illustration — every figure was produced by the product evaluating requests. The traffic behind it is simulated: the tenant is a seeded demo estate, not a customer and not a production deployment, so the numbers describe that estate and nothing else. What they do show is how the surfaces read together — decisions and blocked calls over the same window, an approval queue with real waiting times, a verdict feed naming each tool call and the policy that decided it, and latency broken out to p99 rather than an average that hides the tail. Your own console will show whatever your estate actually is, slow percentiles and denials included.

01 / Attempt What the agent tried to do

The action and its arguments as they arrived at the seam, with the agent identity and environment attached.

  • agent · environment
  • tool call · arguments
  • risk factors at the time
02 / Verdict What the control decided

The outcome, the policies that matched, the explain code behind it, and the approval path if the action was escalated to a person.

  • allow · deny · require approval
  • matched policies · explain code
  • approver · decision latency
03 / Consequence What followed from it

The alert it tripped, the incident it opened, the timeline entry it wrote, and the post-mortem that closed it out.

  • alert · incident
  • audit timeline · decision chain
  • post-mortem · action items

SHIPPED SURFACES

Not one dashboard. A set of answers, each with a home.

These are the decision-observability surfaces in the product today, listed by the question each one exists to answer. Several were consolidated into tabs of a parent hub during navigation work; where that happened, the parent is named rather than a dead path.

SurfaceThe question it answersWhere it lives
Live decision feedWhat is being allowed, denied and held for approval right now, and against which tool calls/events · /activity
Agent fleet healthWhich governed agents are slowest, and how each one ranks against the rest of the fleetAgents hub · health
DriftWhich policies were added, changed or removed since the recorded baseline, and which configuration diverged/drift
TracingThe decision path for one call — spans, timings, and the agent dependencies it reveals/tracing
Anomaly detectionWhich decision metric moved outside its learned baseline, by how much, and by which method/anomaly-detection
RiskHow consequential an action was judged to be, and which factors drove the score/risk
Execution postureFor a governed action: which principal, which tenant binding, which policy decision, what evidenceSecurity · execution posture
Governance timelineWho approved, assigned, deferred, escalated or revoked — across approvals, incidents, drift and exceptions/governance-timeline
Audit timelineThe recorded decision chain replayed as a sequence rather than a tableAudit hub · timeline
Governance graphHow a policy, control, agent, incident and piece of evidence are actually connected/governance-graph
Agent topologyWhich agents call which, and what the blast radius of one of them isAgents hub · graph
SLO definitionsWhat targets governance operations are held to, over which window, for which customer tier/sla
Alerts & rulesWhat should page a human, on which threshold, with which automatic response/alerts
IncidentsWhat is open, at what severity, assigned to whom, on which agents and policies/incidents
Post-mortemsWhat happened, what caused it, and which action items came out of it/postmortems
Governance analyticsOver a rolling 30 days: actions evaluated, blocked and held, and the tools blocked most often/analytics
DashboardsA composed view of the metrics one team cares about, with its layout kept and cloneableDashboard builder

WITHOUT BEING ASKED

What the system notices on its own.

Nobody watches a console all day. The surfaces above are where an investigation goes; what follows is what raises its hand first — named methods, stated thresholds, and no black box in between.

Statistical detection

Three classical methods, run together, best score wins.

Z-score against a trained mean and standard deviation at a configurable sigma, Tukey IQR fences at a configurable multiplier, and an exponentially weighted moving average tracking the recent level. Each scores the same observation and the highest anomaly score is the one reported, with the method named on the result.

Isolation Forest

An ensemble that scores the same input the same way twice.

An implementation of Liu, Ting and Zhou's isolation forest — a hundred trees over 256-sample subsamples, scored by expected path length against the average path length of an unsuccessful binary search. The forest is seeded deterministically from the model identifier, so inference is reproducible rather than a different answer each restart.

Targets and severity

Four metrics, three severities, one open record per condition.

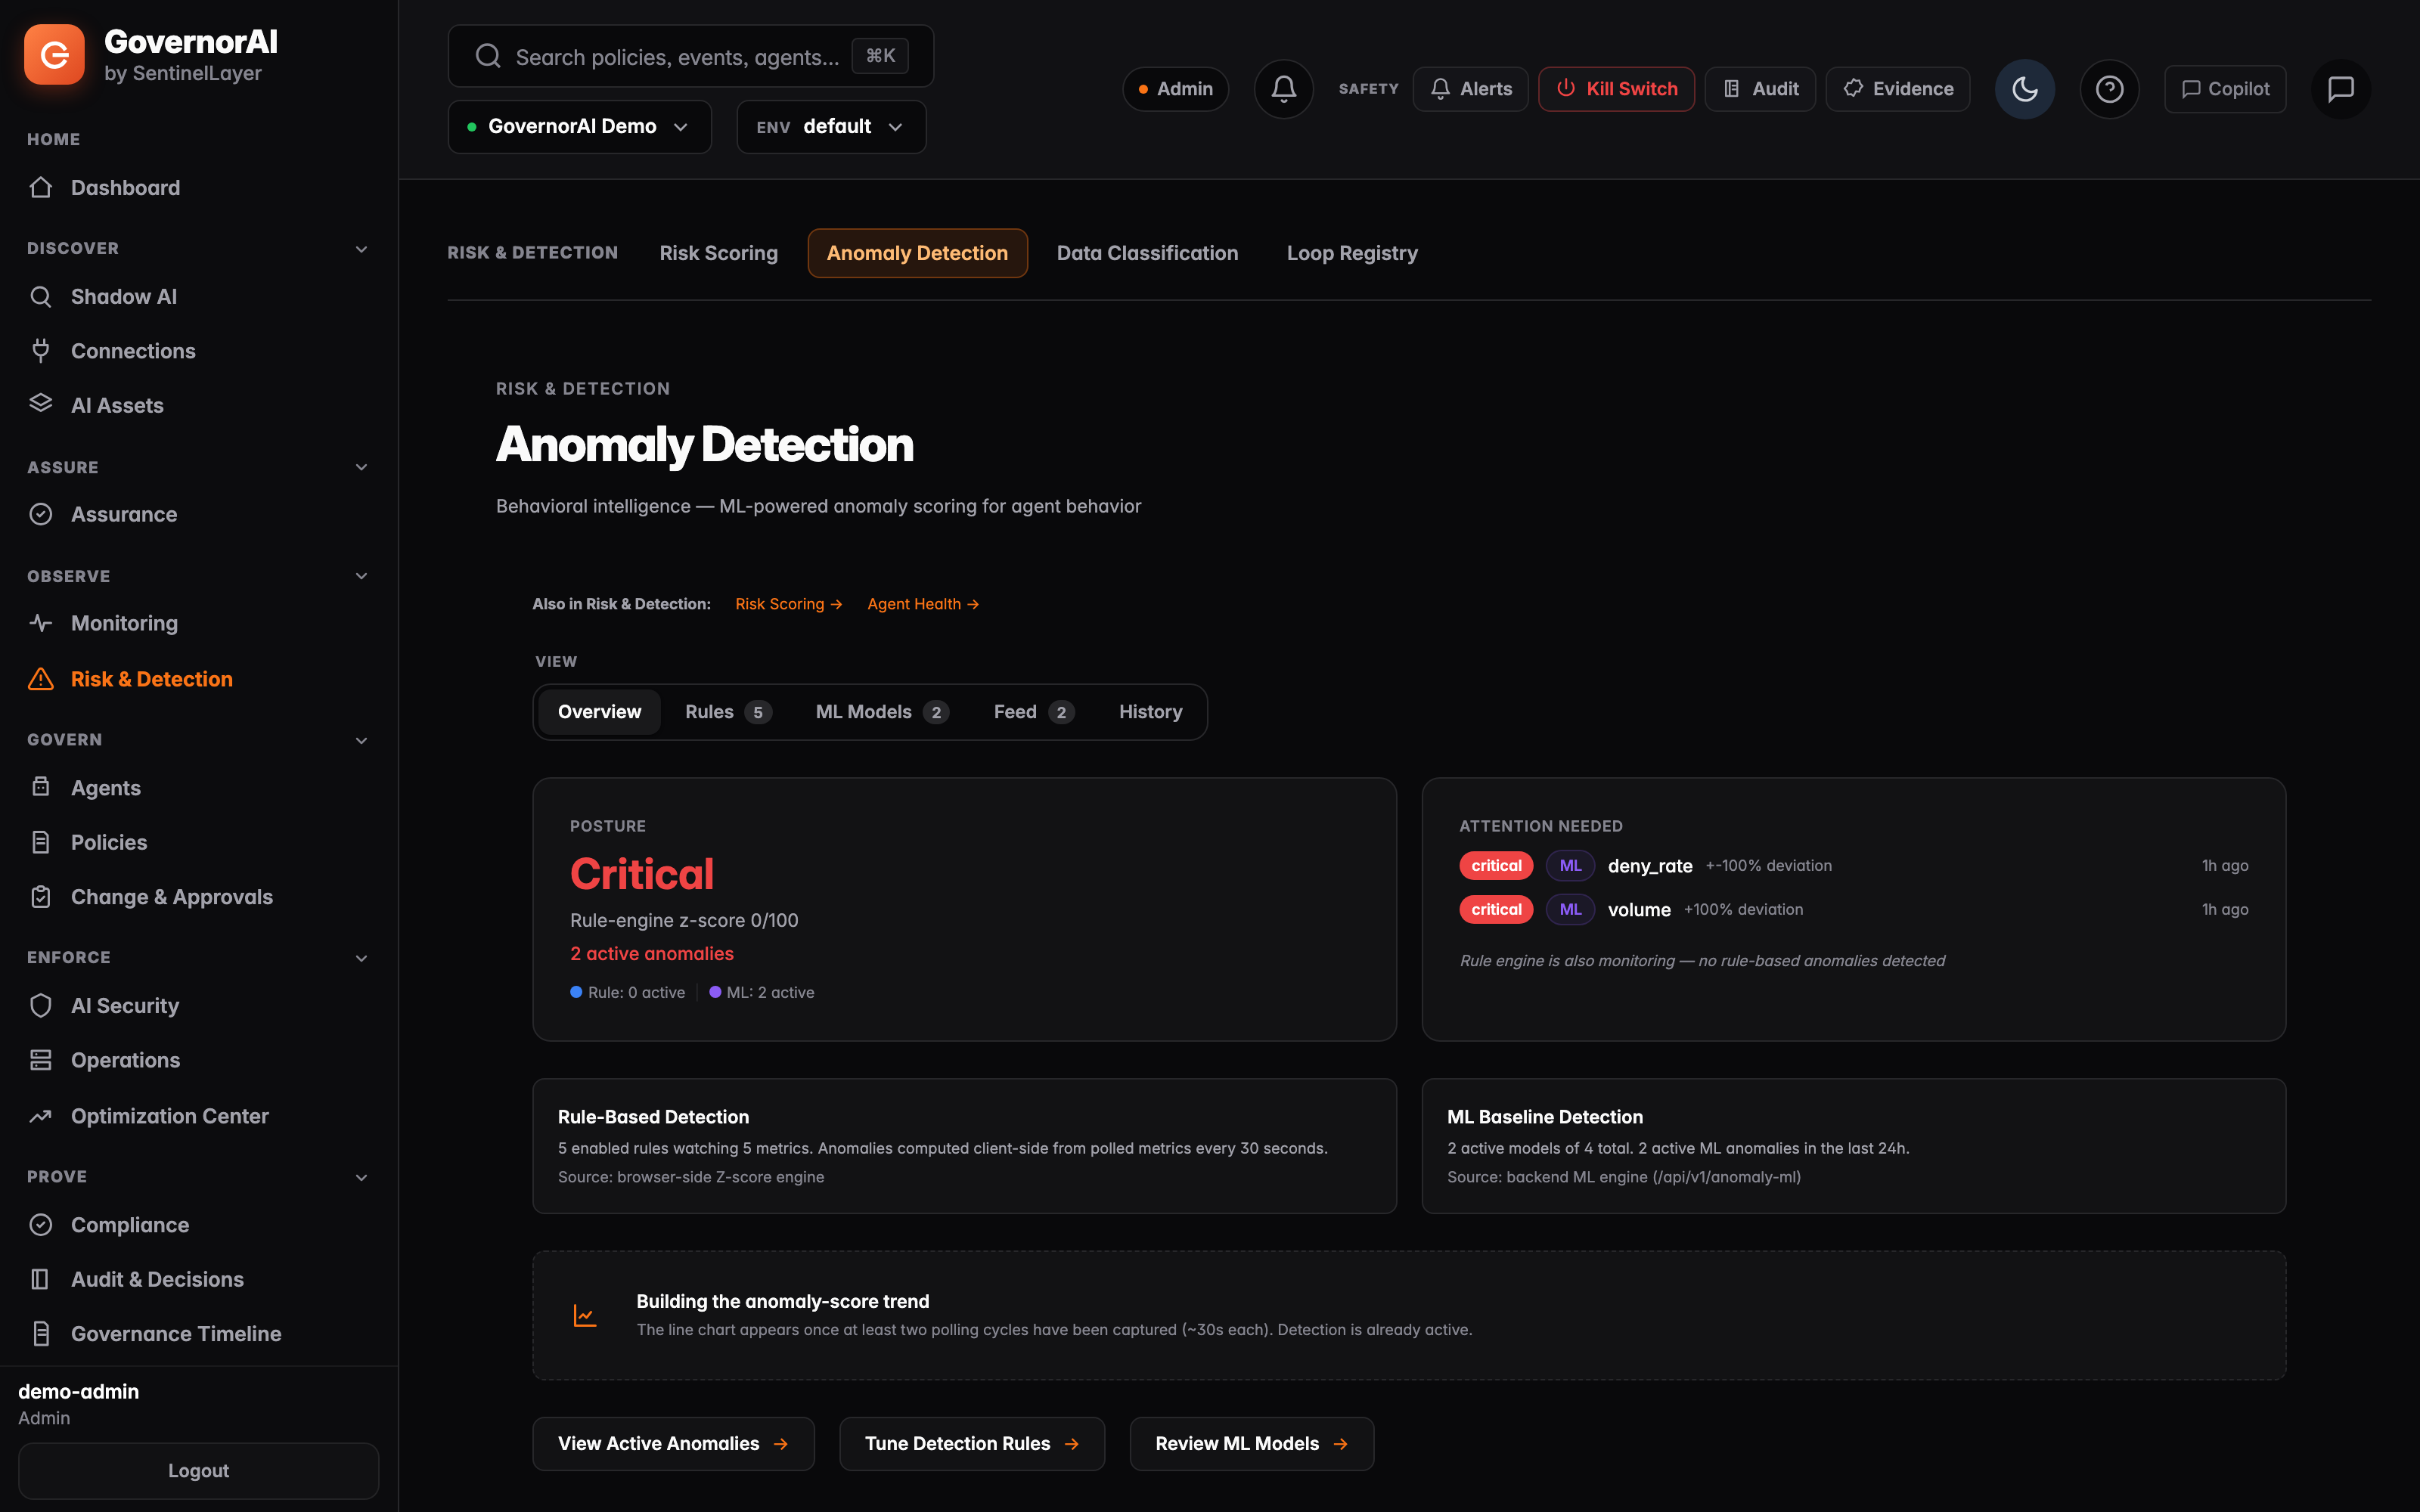
Models are trained per target metric — deny rate, latency, error rate and decision volume — and results are classed critical, warning or info by score. A sustained condition raises the occurrence count on a single open anomaly rather than a new alert every cycle, and severity only ever escalates upward.

Models that admit their limits

A model with no live source is paused, not left reporting.

Each target metric has a declared provider — the event store for volume and deny rate, gateway latency, HTTP error rates. If a model's metric has no live provider in your deployment, the model is demoted to paused rather than left active over nothing. Flagged anomalies can be marked false positive, and the false-positive rate is computed from those marks.

Drift

A snapshot diff against the baseline you approved.

An on-demand scan compares live policies and configuration against the stored baseline and reports what was added, modified or deleted, graded by severity — a deleted policy is critical, a modified one high. The first scan records the baseline instead of reporting drift, so nobody starts with a screen of false positives.

Drift disposition

Marked, tracked, and never silently reverted.

Critical drift opens an incident. Every record can be acknowledged, remediated, deferred or ignored, and each of those is written to the governance timeline with the person who did it. Severity thresholds you set can mark a record auto-remediated — that is a tracked disposition, not a rollback. GovernorAI does not quietly rewrite your policies back.

Fleet SLOs

Error budgets, burn rate, and an incident that opens itself.

Availability and latency objectives are tracked as an error budget with a burn rate, categorised fast, medium or slow against the standard multi-window thresholds. A detector evaluates each objective per agent on a thirty-second cycle, opens an incident on breach and resolves it on recovery — with mean time to detect, acknowledge and resolve computed from the records themselves.

Behavioural signals

Spikes that describe themselves, and never fail closed.

A burst of policy denials in a short window, a spike in restricted-classification data access, or one agent suddenly reaching for many distinct tools. Each has a stated default threshold and window, each is environment-tunable, and each is advisory only — a behavioural signal raises an assessment, it never blocks an action and never downgrades a worse verdict already derived from telemetry.

DERIVED FINDINGS

The governance graph is projected from live state, then reduced to four claims.

Nodes and edges are rebuilt on demand from the policy engine, policy assignments, agent registry, group hierarchy, model associations, evidence store, approvals, kill switches and incidents. If any upstream read fails, the rebuild aborts before it deletes anything — a transient error cannot purge your graph.

ungoverned_agent An agent no policy governs

An agent node with no incoming policy-sourced assignment edge. Group-mediated coverage is expanded to per-member edges first, so a group-governed agent is never falsely flagged.

active_kill_switch A target currently quarantined

A kill switch is engaged, so actions for that target are being stopped. Carries the scope and target it applies to.

pending_approval A decision waiting on a person

An approval request still awaiting a human. Terminally escalated requests are deliberately excluded so they are not reported as live work.

open_incident An incident not yet closed

Echoes the incident's own recorded severity. The finding never invents a severity, and the graph never invents a numeric risk score.

Fail quiet, not fail loud

A failed read suppresses the finding rather than inventing one.

The ungoverned-agent finding depends on the edge projection. If that projection cannot be loaded, the finding is suppressed entirely — because the alternative is flagging every agent in the estate as ungoverned on the strength of a failed database read.

Tenant-scoped by construction

Findings are computed over one account's projection, as a pure function.

The derivation reads a single tenant's nodes and edges and computes findings without reaching outside those slices. There is no cross-account path to leak through, and the output order is deterministic.

PROVENANCE

When it does not know, it says so.

The failure mode of a governance console is not a missing chart. It is a confident chart over data nobody measured — and a reviewer who cannot tell the difference. So the product answers that question directly, on the record, per tenant.

Live proof

Live, stale, historical only, or no data.

A dedicated endpoint states which of those four your tenant is in, alongside the timestamp of the last governed event, the timestamp of the last measured latency sample, and the sample counts inside the window you asked for. A quiet dashboard is therefore distinguishable from a broken pipeline.

Row provenance

Every row declares where it came from.

Agent health and tracing each expose a status surface reporting whether the rows on screen are live runtime data, seeded demonstration data, persisted-but-not-live records, or of unknown provenance. A provenance check that itself fails reports unknown — never live.

Unbacked metrics

A widget with no source renders a sentence, not a number.

Dashboard widgets whose metric has no connected data source return an explicit no-data state with the message that no live source is connected yet. They do not fall back to a plausible-looking figure, and the metrics that are genuinely backed are a named, finite list.

Coverage buckets

Live, configured, or roadmap. There is no fourth bucket.

The execution-posture surface reports each control family as live, configured or roadmap — and refuses to promote a family to live on configuration alone. Brokered short-lived credentials, for example, only report live when an actual governed action carries that credential mode; a mixed fleet is reported as mixed.

Stated precisely Every number on these surfaces is either measured or labelled as not measured.

That is a design constraint, not a feature. A governance record whose provenance you cannot establish is worth less than no record at all, because it will be believed.

FROM SIGNAL TO POLICY CHANGE

Observation is only useful if it can change the control.

The point of watching decisions is to change the decision next time. That path exists as product rather than as a diagram: a threshold trips, a rule acts, an incident opens, a post-mortem records the cause, and the policy changes it produced are carried on the record.

Alert rules

A threshold that can pull the brake.

Rule actions are not limited to notification. A rule can open an incident, pause a policy, engage a kill switch or run a runbook — so the response to a spike in denials or latency is a governed action, not a message someone reads on Monday.

Incidents

A lifecycle, with the governance objects attached.

Open, investigating, mitigating, resolved, closed — at critical, high, medium or low severity, carrying the related alerts, agents and policies, with a timeline of status changes, comments, actions taken and escalations appended as they happen. Mean time to resolve is computed from those records, not configured.

Post-mortems

Draft, in review, published.

Root cause, contributing factors, lessons learned, attendees, impact summary, a detection-to-resolution timeline and prioritised action items from P0 to P3, with overdue items tracked against their due dates — and the related policy changes referenced on the post-mortem itself.

Accountability records

Four things a reviewer will ask, each written down as it happens.

Policy approvals, incident coordination, drift remediation ownership and exception lifecycle each write a record and a governance audit event in the same transaction. Reviewer identity is derived server-side from the session, not accepted from the client, and an exception past its validity is expired by a background sweep rather than left standing.

Decision chains

The audit timeline is fed by enforcement, not by a sidecar.

Gateway decisions, approval workflows, kill-switch activations, change management, maintenance windows and health incidents all write into the same timeline, linked into parent-and-child decision chains with an outcome and a duration. Repeated writes of the same identifier are idempotent, so a retry does not inflate the count.

Export

It can leave, into the stack you already run.

OpenTelemetry instruments under a single namespace — governor.request_count, governor.request_latency, governor.policy_evaluation_duration, governor.decisions_total — with W3C trace-context and baggage propagation and named spans for policy evaluation and proxy execution. Exporters for OTLP, Jaeger, Zipkin and Prometheus are selectable per deployment; nothing leaves until you configure one.

Stated precisely Every surface on this page reads the same governance record the enforcement path writes.

Decision observability is not a parallel telemetry pipeline bolted alongside the product. It reads the decisions, approvals, incidents and timeline entries the governed path already produces — which is why the trail an investigator follows and the trail an auditor is shown are the same trail.

IN THE PRODUCT

The surface this page describes.

Event Log — GovernorAI console
Event LogTyped governance events, filterable by outcome
Anomaly Detection — GovernorAI console
Anomaly DetectionMetrics outside their learned baseline
Governance Graph — GovernorAI console
Governance GraphTyped nodes and edges, derived not hand-drawn

Continue